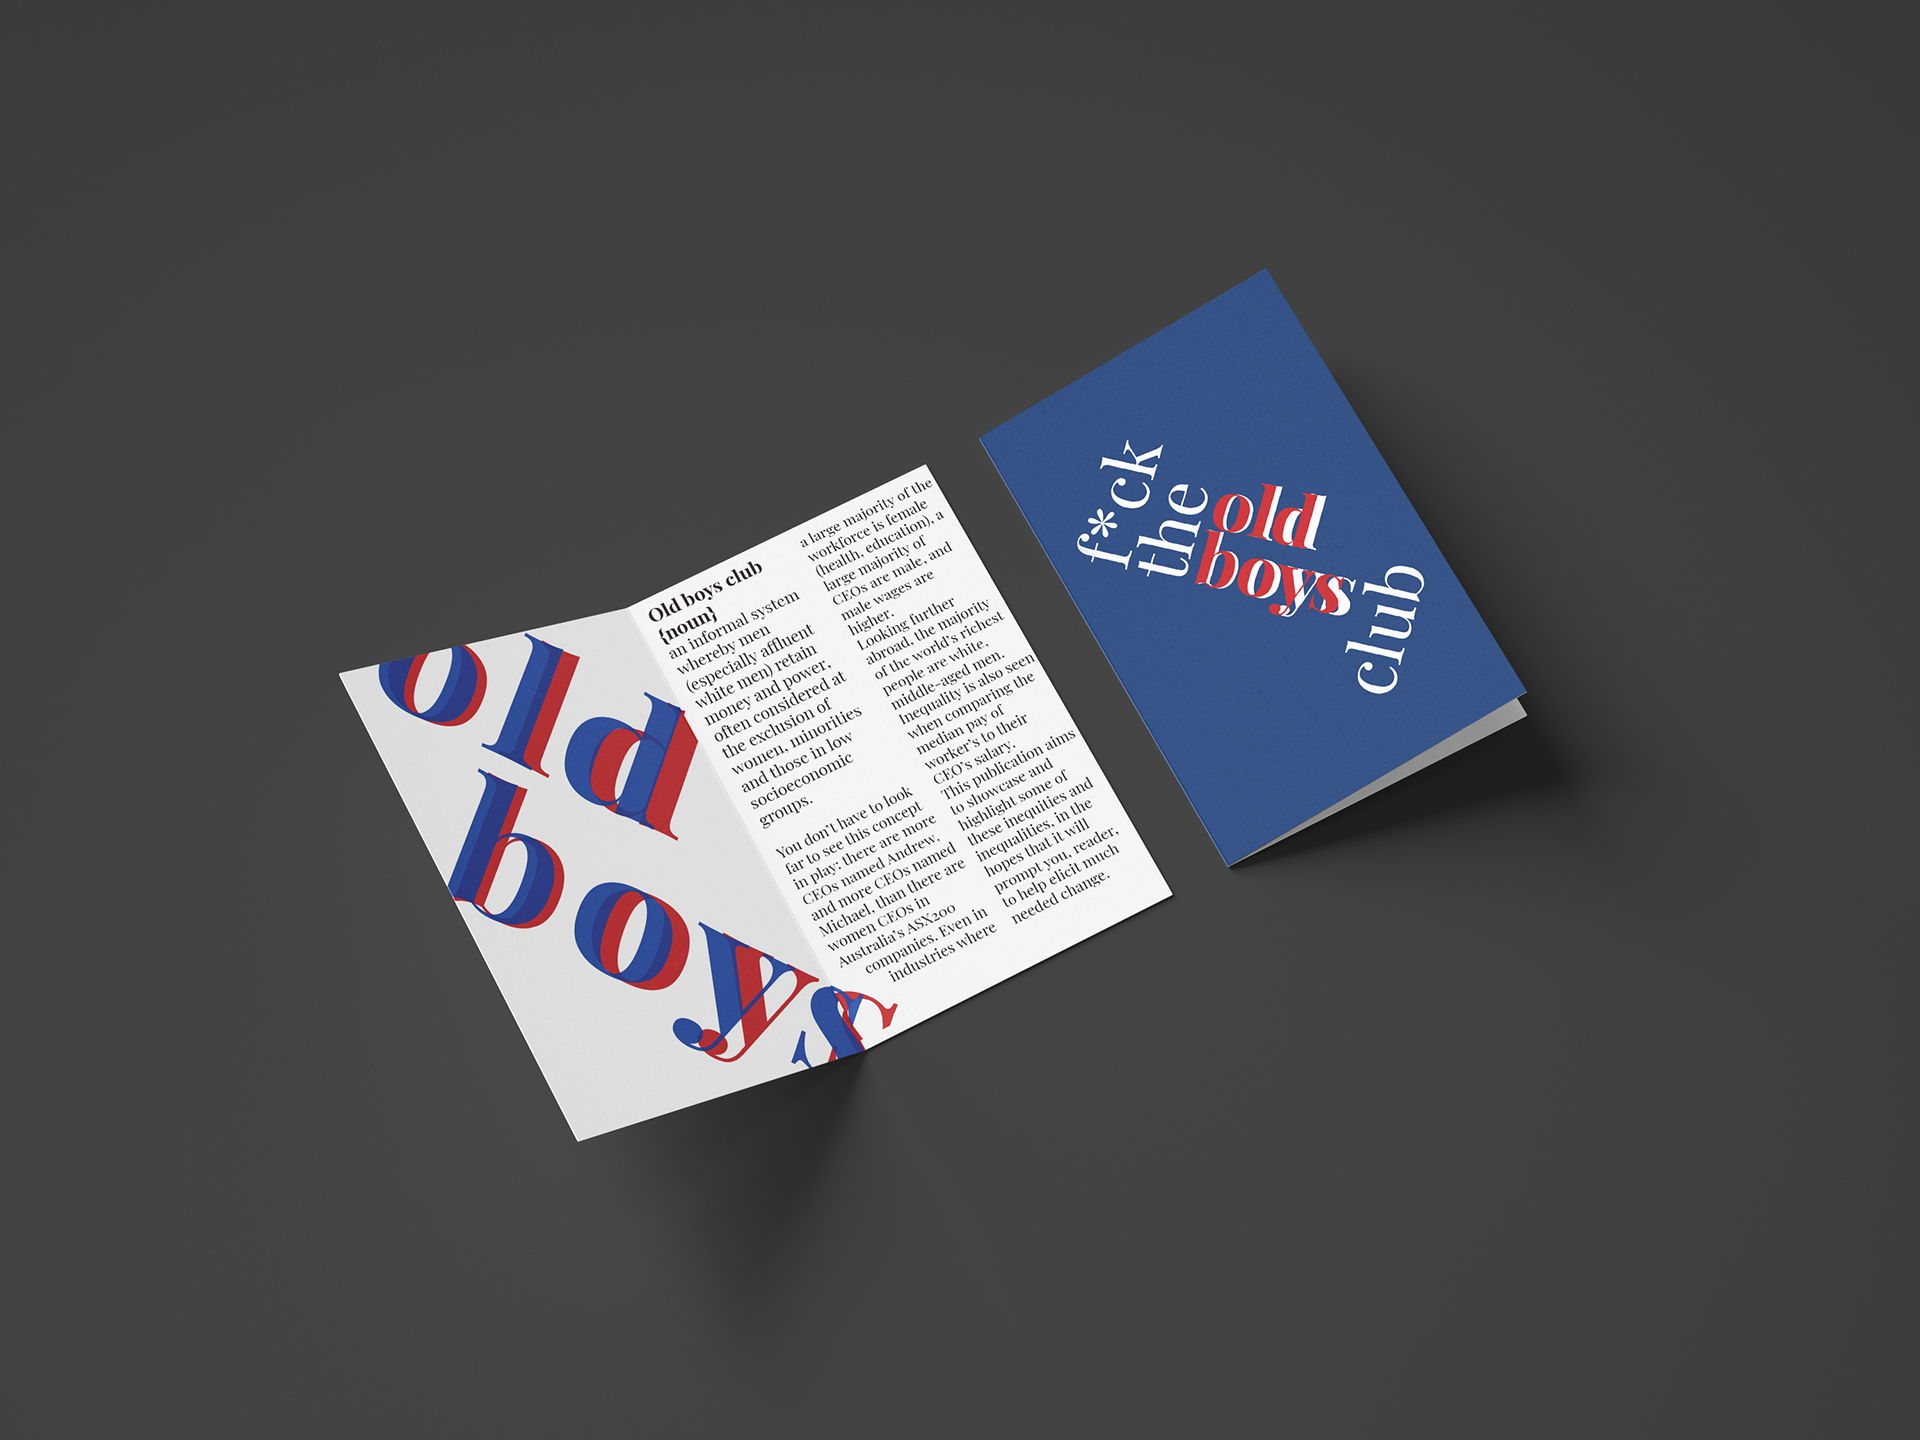
I wanted to experiment with using complex sets of data (from large tables), and creating striking visuals that allow the reader to see the entire data set within their field of view. For this project, I have chosen inequality, and the prevailing notion of the “old boys club”, that prevents women and minorities from reaching their full potential in the world.
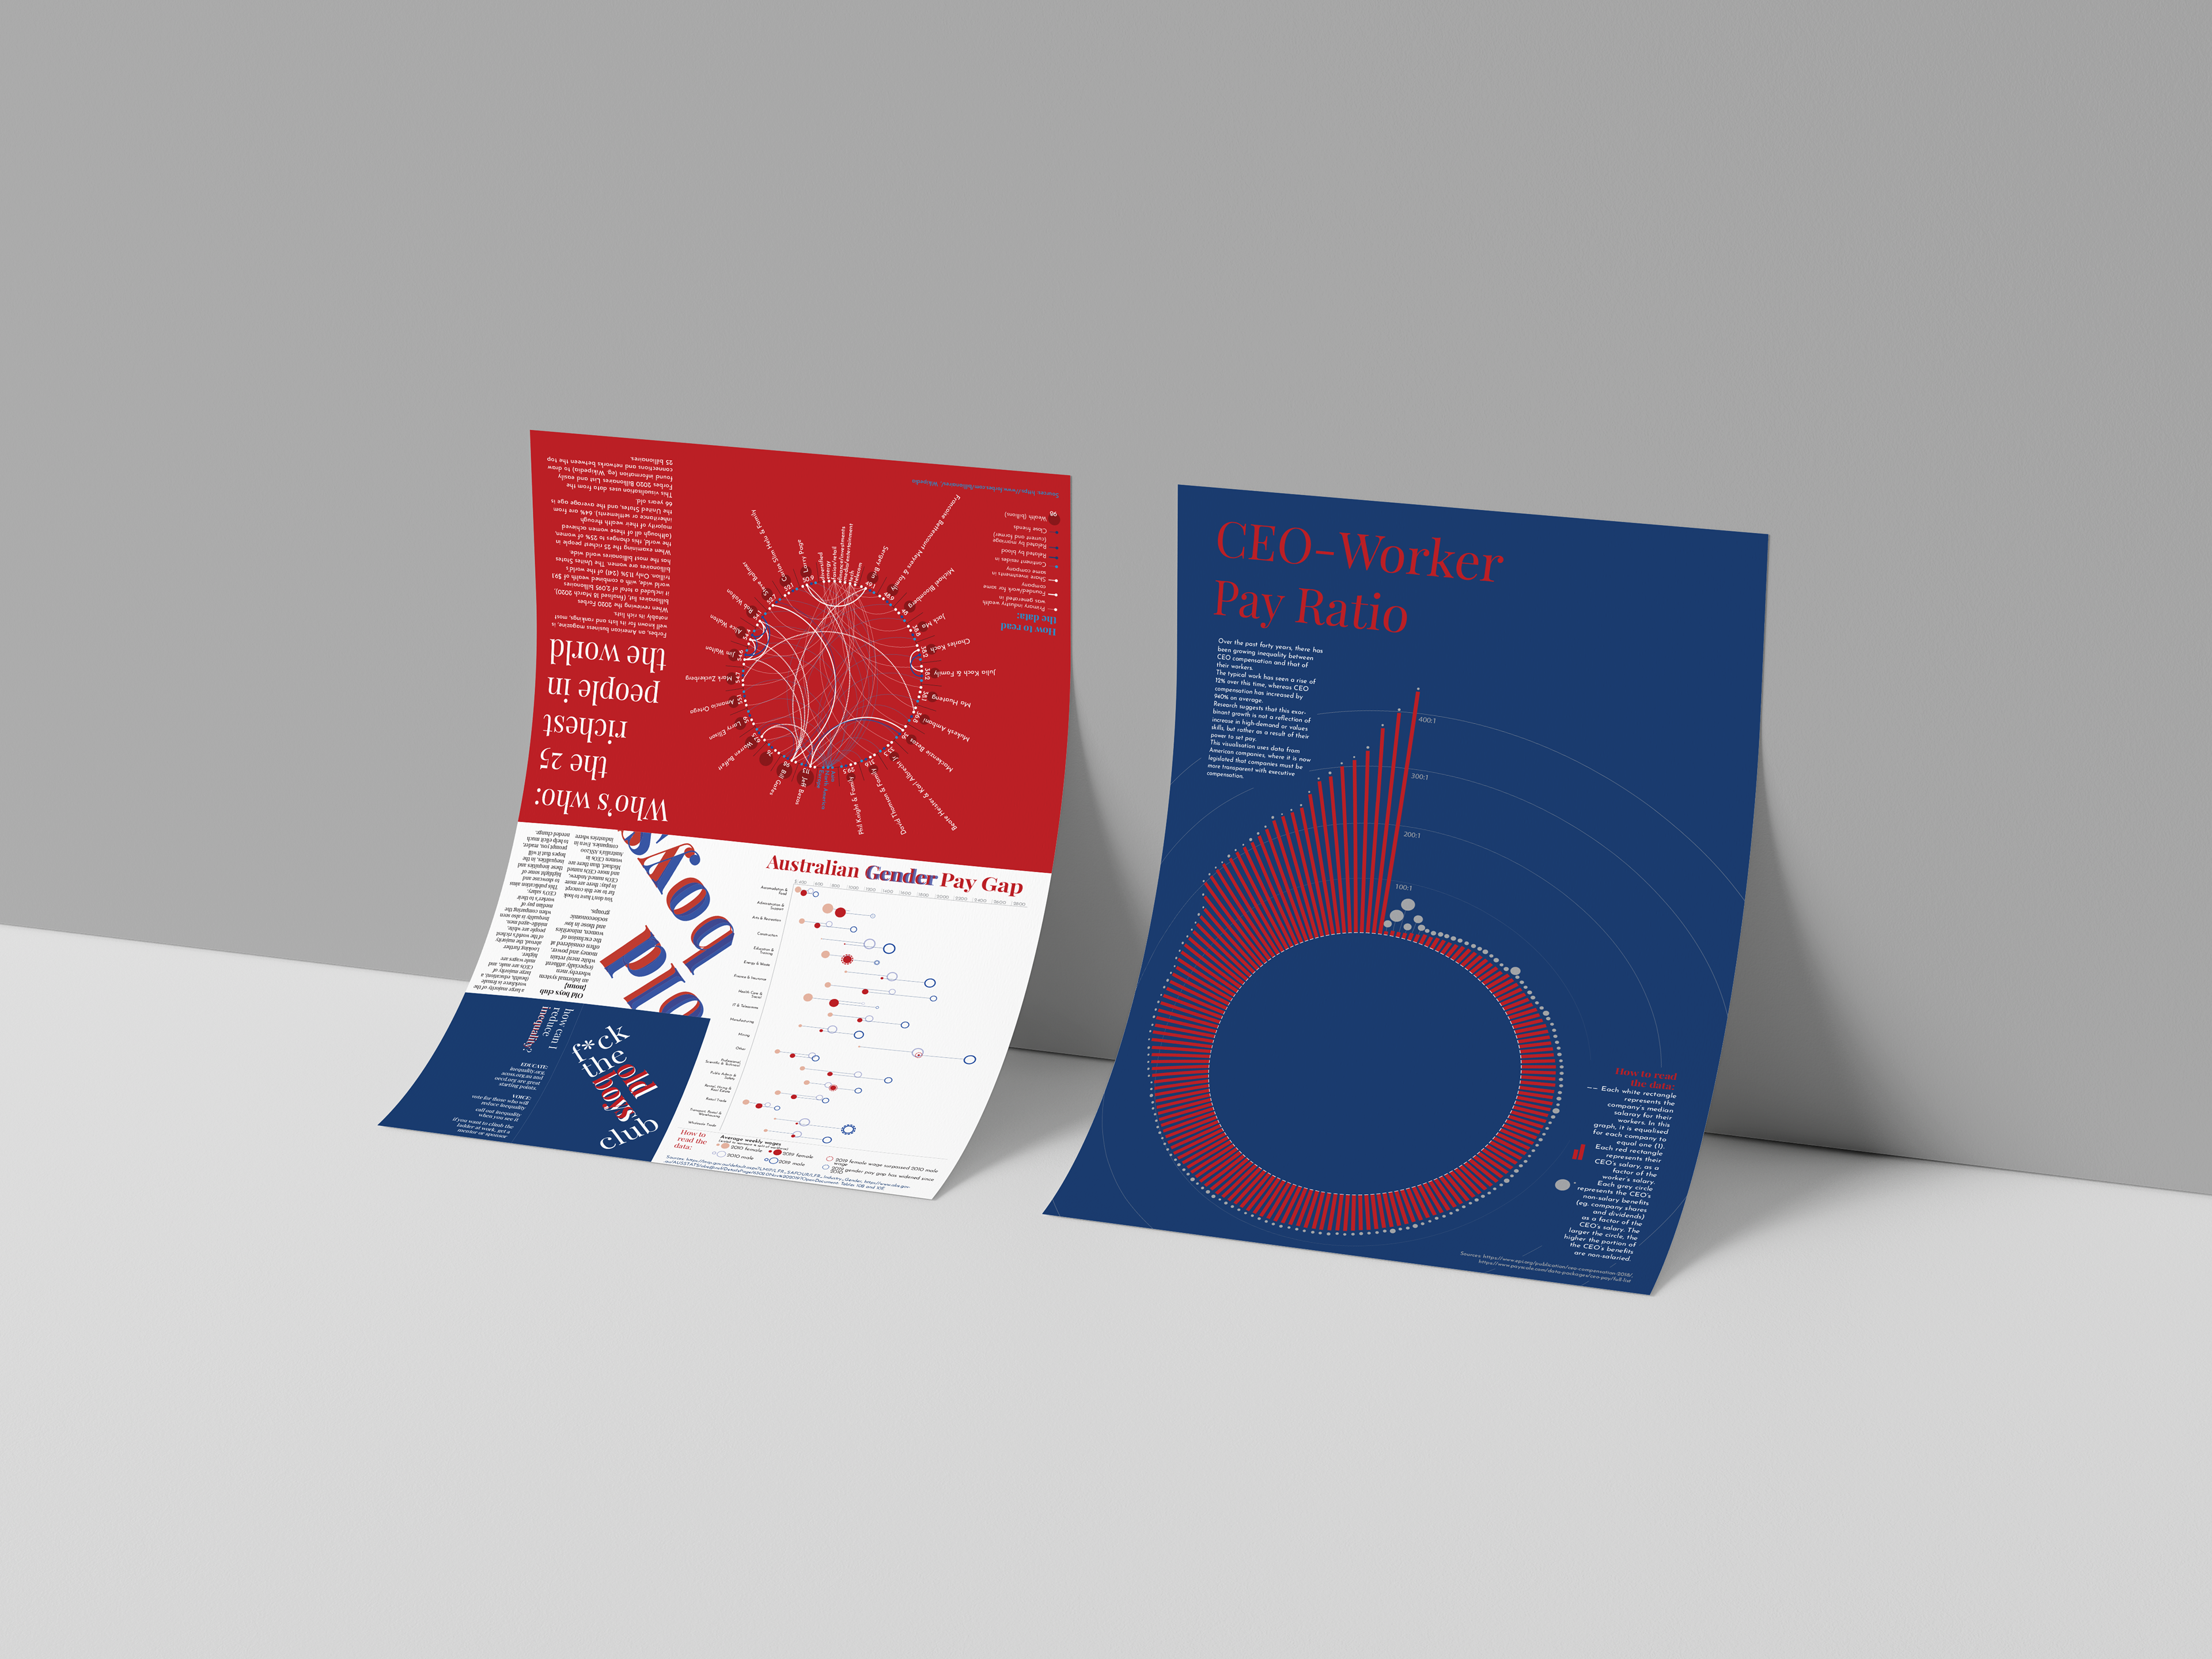
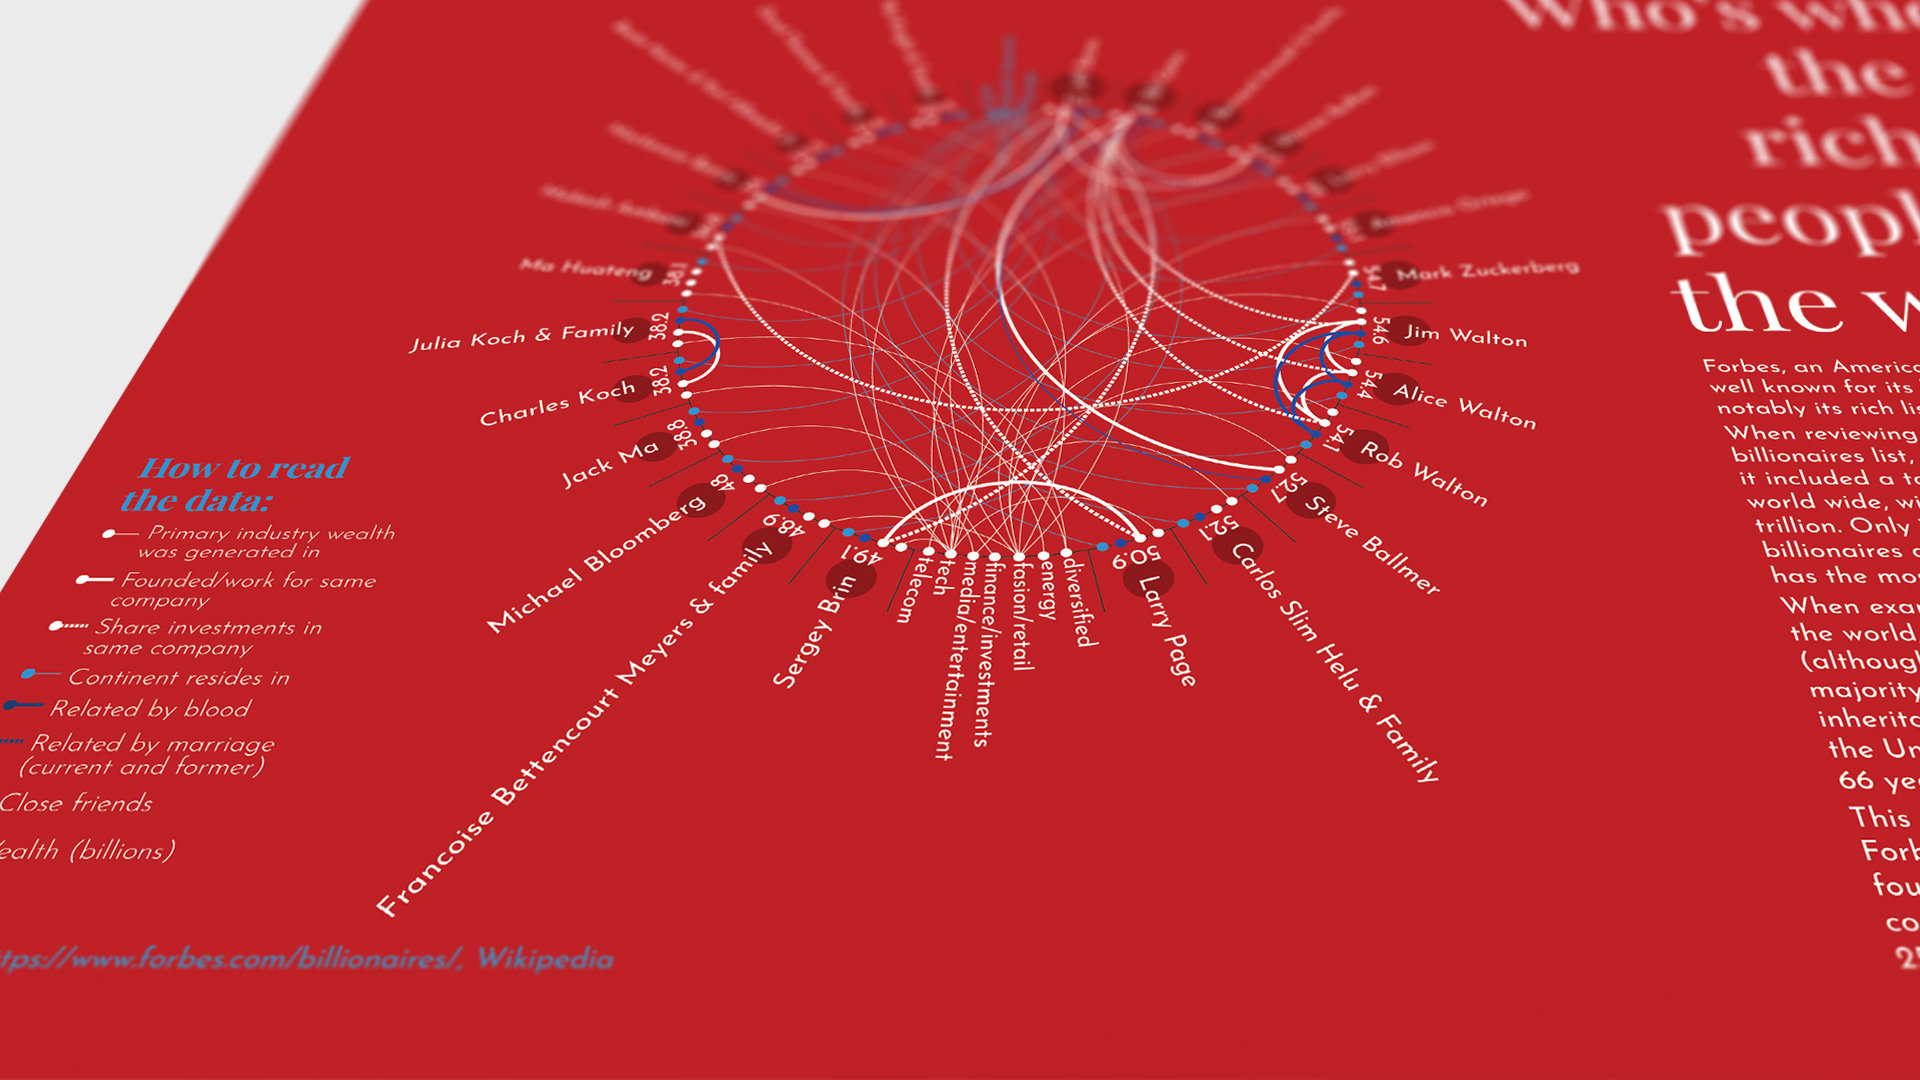
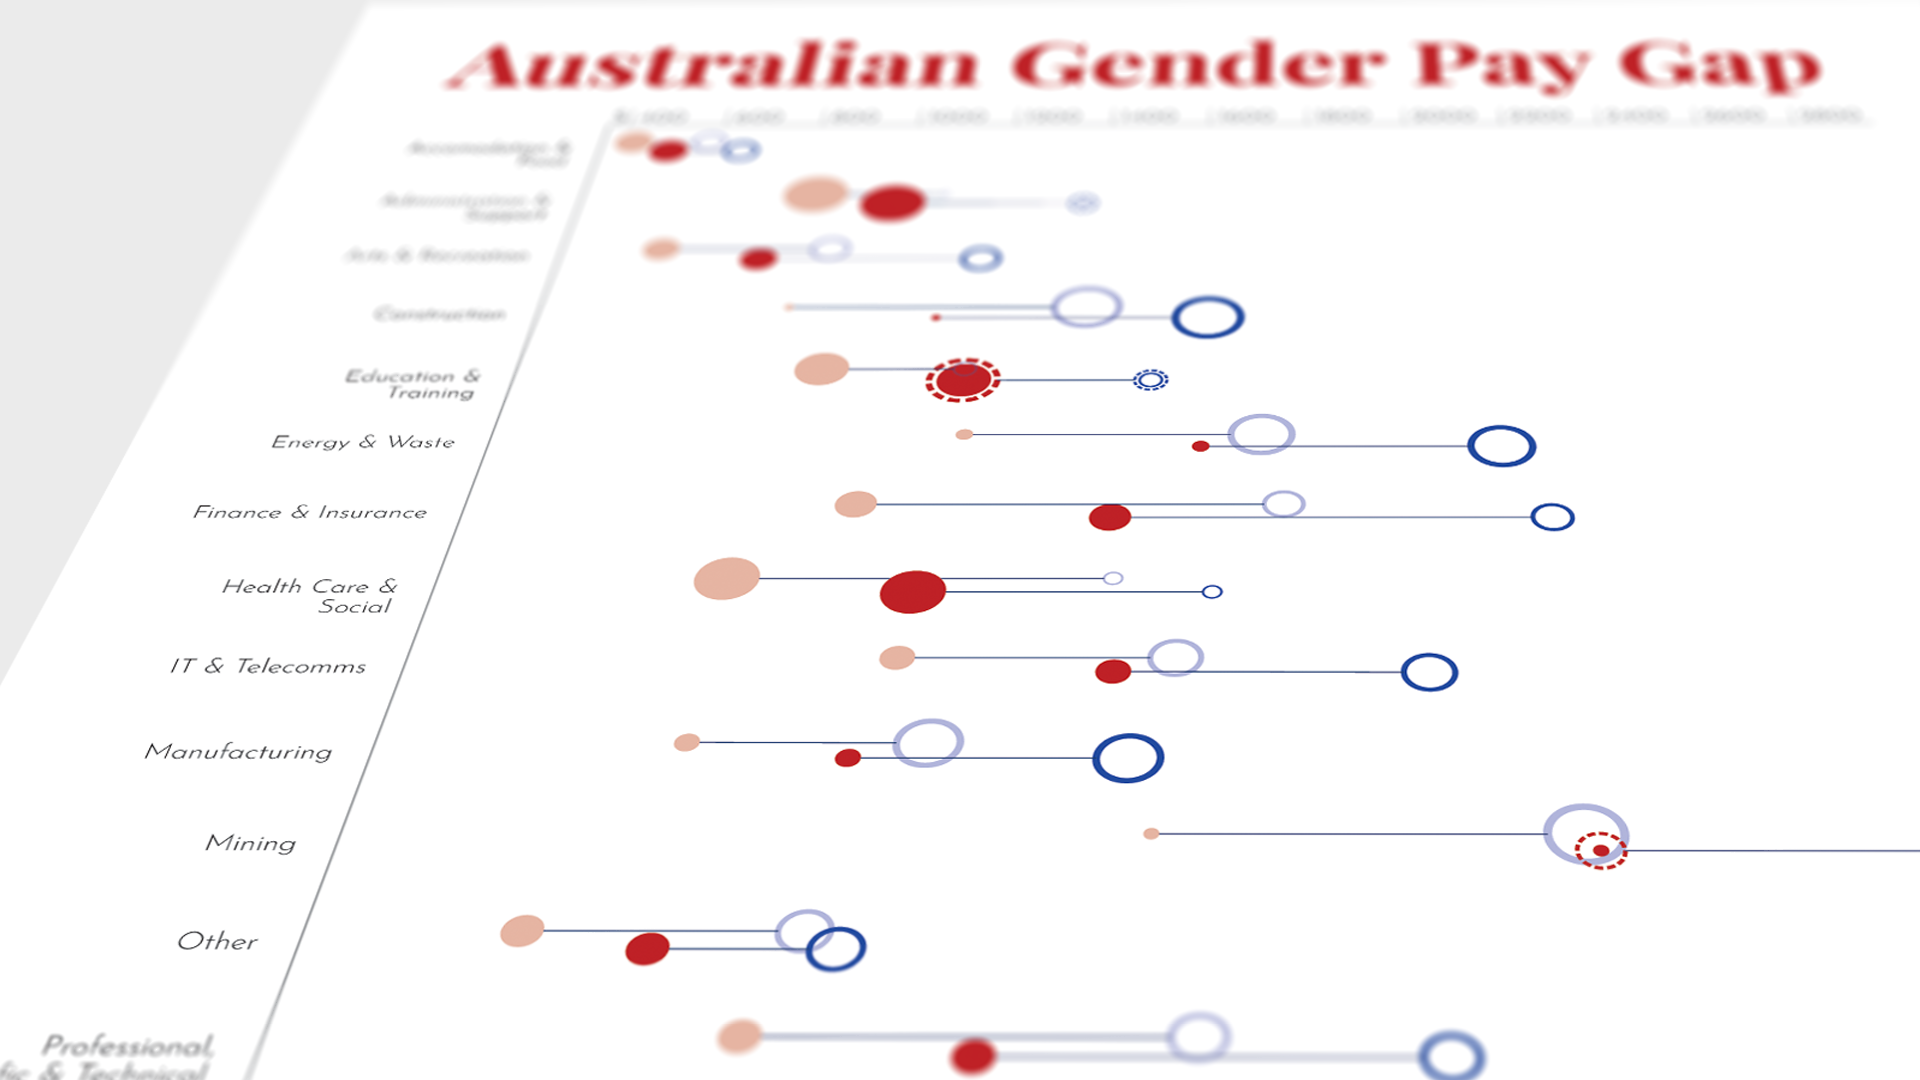
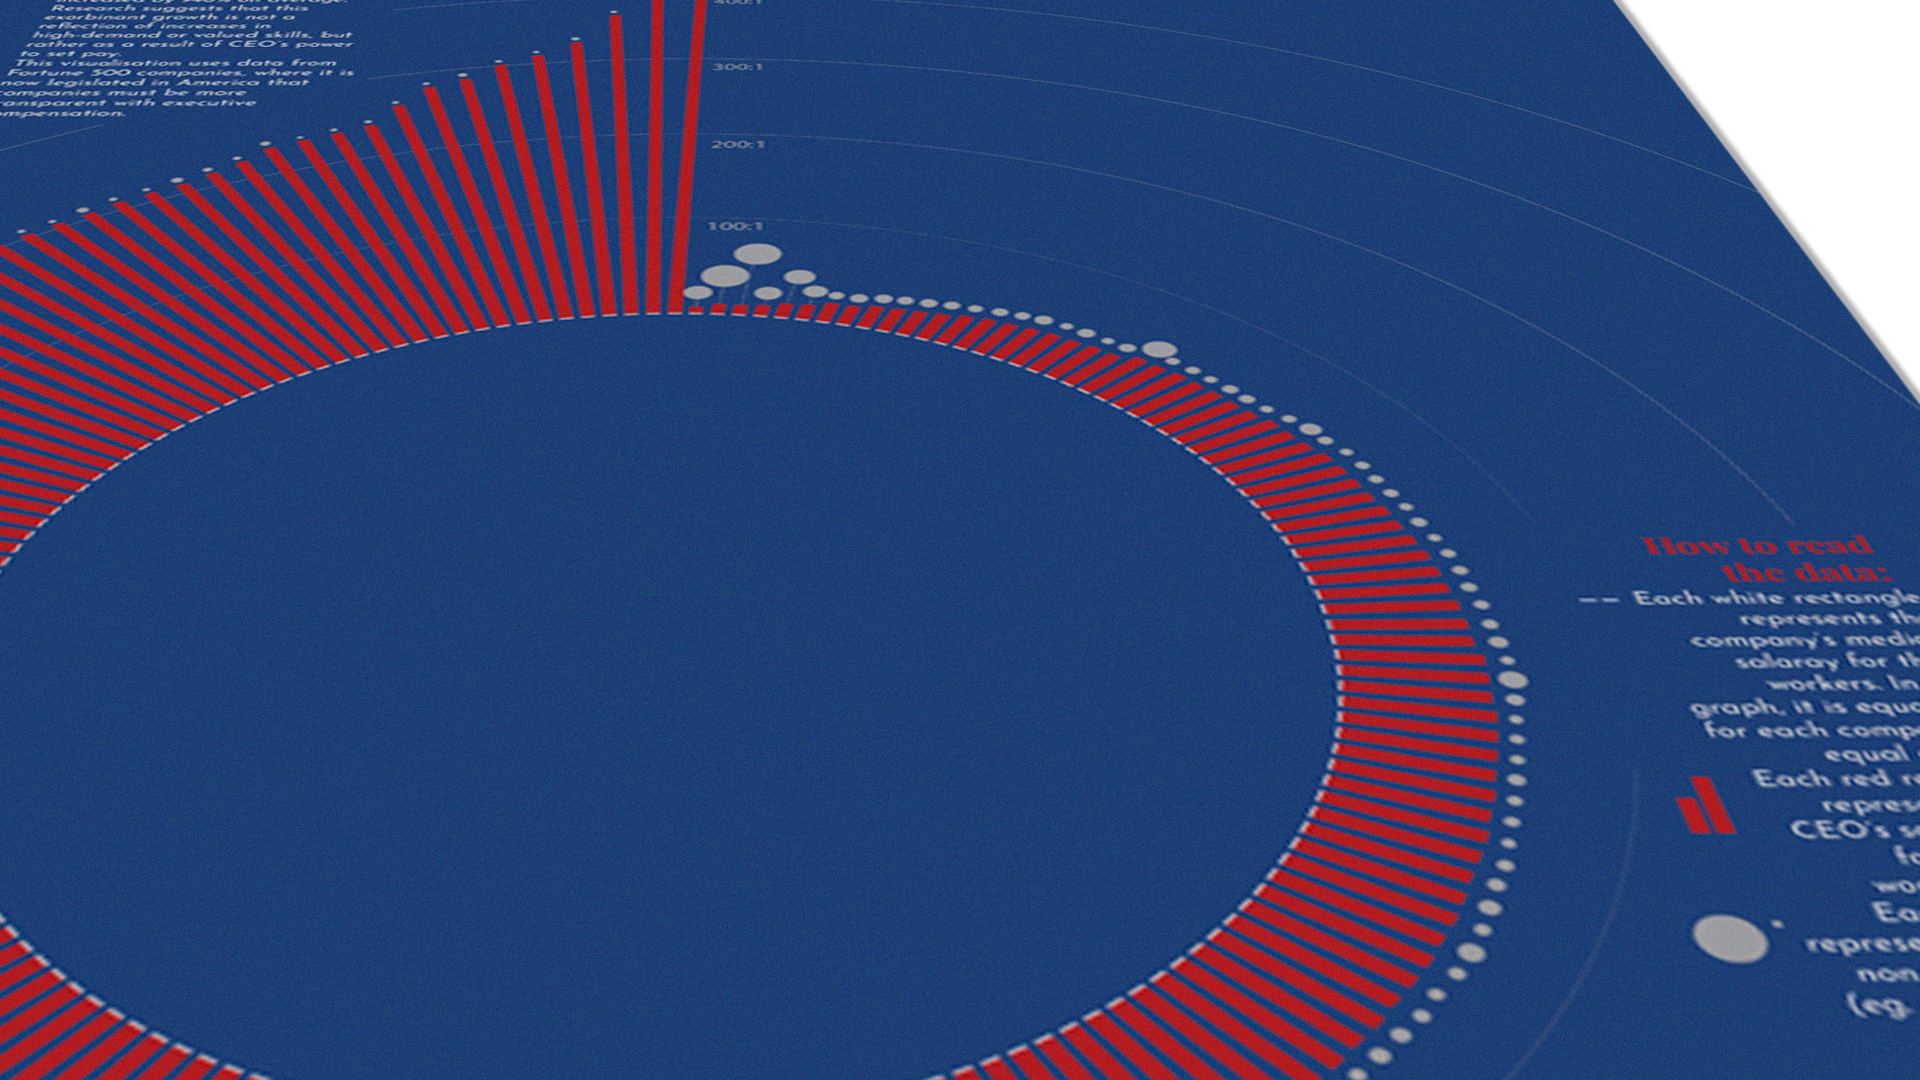
The core elements of the project are three data visualisations (click links for full-res versions). The first visualisation shows the gender pay gap that exists in Australia. Inspired by the span chart style, scale of the data points was also used to portray the split in the labour force between males and females. The second visualisation uses a chord diagram to draw connections between the 25 richest people in the world. Colour and stroke width help to differentiate between the different types of relationships and commonalities. The third visualisation uses a radial bar chart to reveal the ratio between CEO salaries and the median worker salary of Fortune500 companies. Scaled circles also show how much more CEOs received in non-salaried benefits.
Sketches and experimentation with folding were undertaken to figure out the best way to present the visualisation series. Consideration was given to allow each visualisation to be read in isolation, but also combined to create a broader picture. An A3 four-fold brochure/poster was created that incorporates the visualisations and other information found in the display, to allow the viewer to take away a pocket sized version of the project.